Modeling pencil strokes
About a year ago, I wrote a short program to model pencil strokes. The project is still in its embryonic stages and I plan to keep working on it sporadically. I will begin now by revisiting the code written last year to extract its concepts.
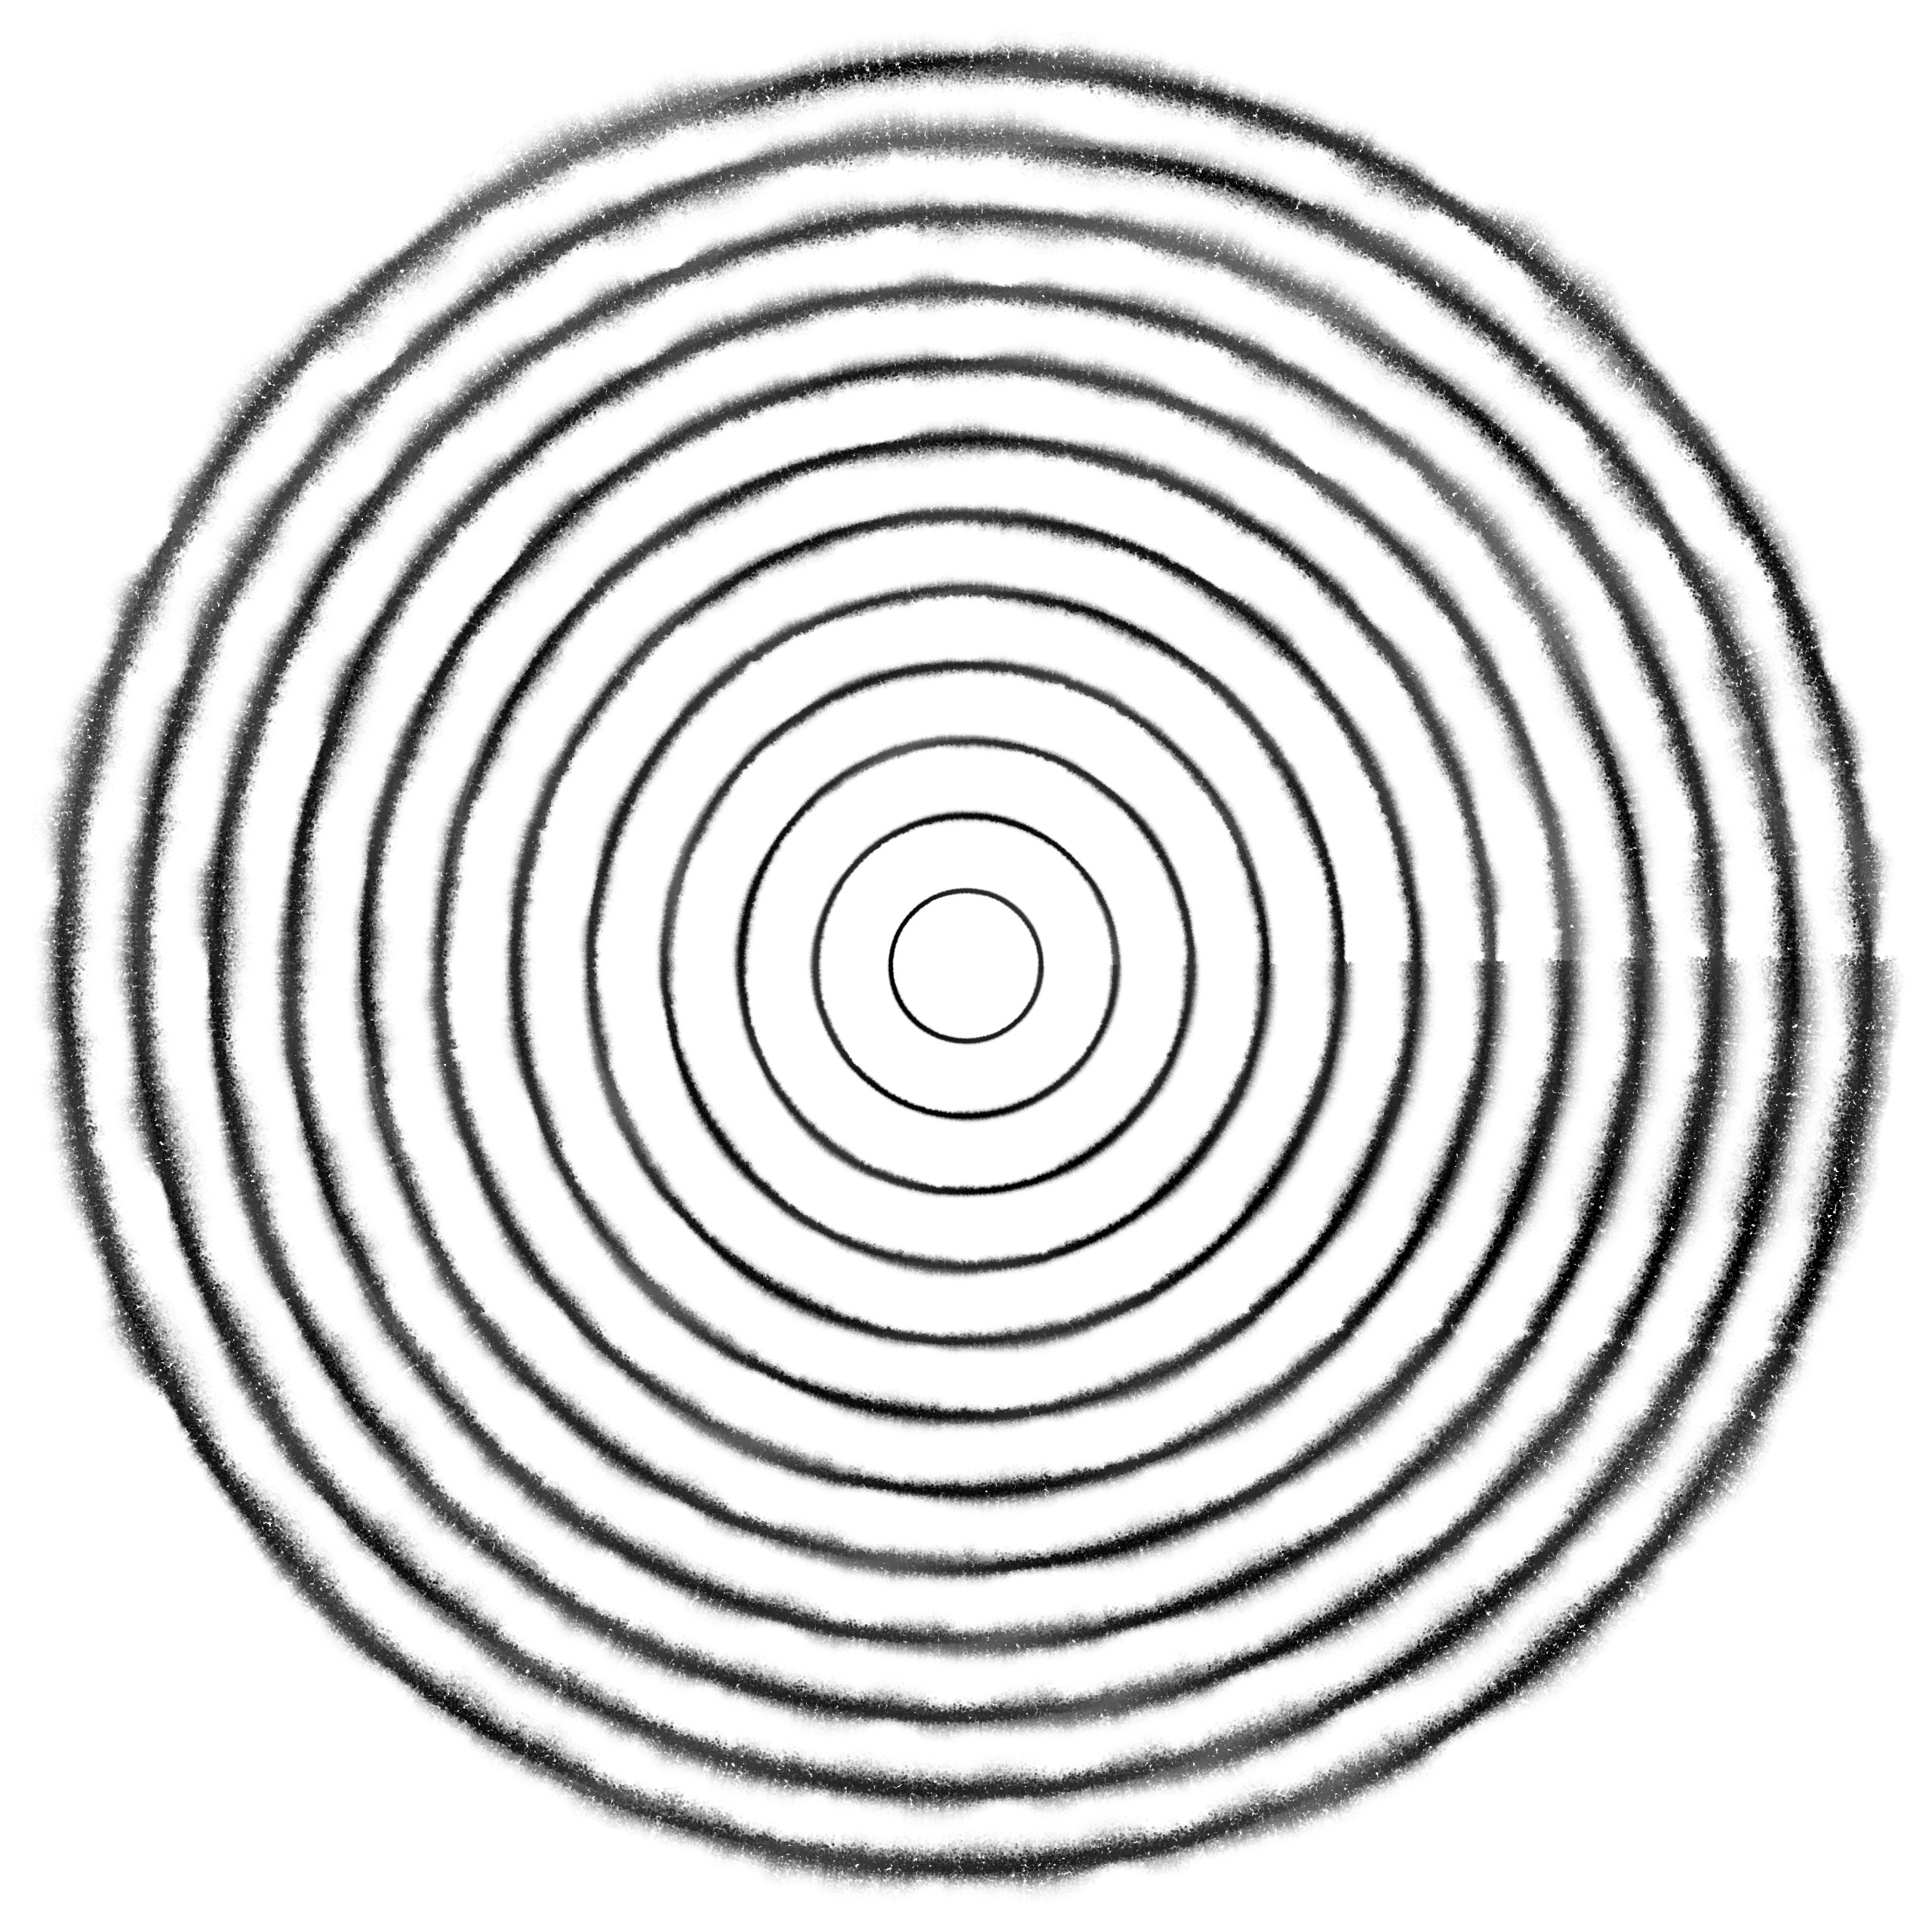
The circular lines above were generated by this program. They have several problems that need to be solved. Firstly, they begin and end abruptly; they do not taper off like we would expect hand-drawn lines to do. This creates a very artifical break in the circles. Secondly, while the lines of average width have a relatively natural look,
But is it
graphite, charcoal,
Conté pencil…?
the thinnest and thickest ones look a lot less convincing. Finally, the variations in the width of the lines all seem strangely identical in the lower right quadrant of the circles. An unpleasant regularity seem to have emerged out of this algorithm that tries to model the unpredictability of a physical pencil. Some erroneous trigonometry might be at the root of this.
Normal distribution and semi-random variations
The core idea of this program is to use a normal distribution to simulate the shape of a pencil’s lead. The normal distribution is calculated with this equation:
It plots the curve below:
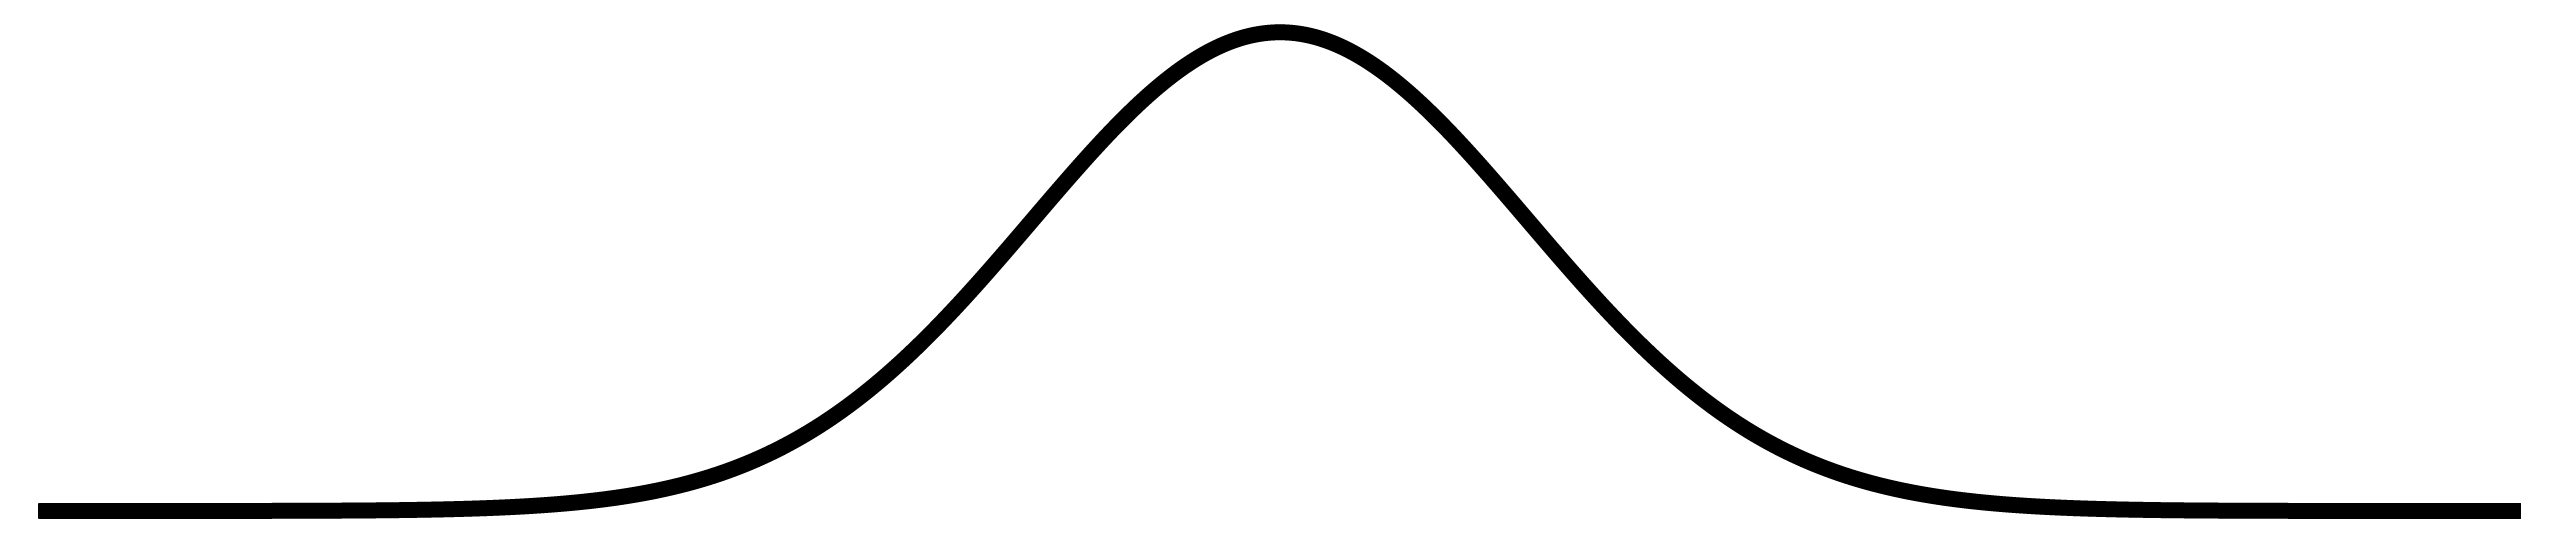
This hill thus represents the extremity of the pencil’s lead (we can ignore the horizontal parts of the curve; they will not be used). The y axis of the curve represents the probability that a particle of the lead will be transfered to the paper.
A real pencil lead, of course, is never as smooth and regular as this hill. On a microscopic scale,
Welcoming
irregularities. both the lead and the sheet of paper are fragmented like mountain ranges. We can imagine that, as the pencil is rubbed on the paper, the lead moves irregularly; its angle relative to the paper changes; its jagged edges are pushed against the paper’s texture at different moments and at varying levels of pressure.
To obtain an irregular lead, the values of the normal distribution equation are altered with Perlin noise. This is what our pencil lead resembles now:
Now,
Drawing
a line.we only have to move this fragmented curve on the plane and draw black and grey dots at its foot. The y value of the curve determines the brightness of the drawn dots: as the y value increases, the dots get darker. The blendMode(DARKEST) option of p5.js also contributes considerably to the final look of the line: a dot is only drawn if it is darker than the dot below.

The source code of the program as it exists now is included below. I have numerous ideas for ways to modify and improve it (detailed below). In fact, it is certain that I will rewrite all of it. You can also find this code on GitHub. It is free software distributed under an Apache 2.0 licence.
var looping = true;
var exporting = false;
var arr = [];
var radiusAugmenter = 0;
var graphiteWeight = 1;

function setup() {
    createCanvas(windowWidth, windowHeight);
    background(255);
    noStroke();
    frameRate(1);
    blendMode(DARKEST);
}

function draw() {
    translate(width / 2, height / 2);
    var total = 100;
    var increment = TWO_PI / total;
    for (var i = 0; i < TWO_PI + increment; i += increment) {
        var x = cos(i) * (50 + radiusAugmenter);
        var y = sin(i) * (50 + radiusAugmenter);
        var vec = createVector(x, y);
        arr.push(vec);
    }
    drawGraphite(arr);
    if (exporting) {
        frameExport();
    }
    radiusAugmenter += 50;
    graphiteWeight += 1;
    arr = [];
}

function drawGraphite(h) {
    var drawCount = 0;
    for (var j = 0; j < h.length - 1; j++) {
        if (h[j + 1]) {
            var v1 = h[j];
            var v2 = h[j + 1];
            var hypotenuse = dist(v1.x, v1.y, v2.x, v2.y);
            var angle = atan2(v2.y - v1.y, v2.x - v1.x);
            push();
            translate(v1.x, v1.y);
            rotate(angle + PI / 2);
            for (var i = 0; i < hypotenuse; i++) {
                translate(0, -1);
                drawGraphiteSegment(drawCount);
                drawCount++;
            }
            pop();
        }
    }
}

function drawGraphiteSegment(t) {
    for (var i = 0; i < 10; i += 0.12) {
        var x = i - 5;
        var y = -(1 / sqrt(TWO_PI)) * pow(2.71828, -pow(x, 2) / 2);
        var noiseValue = i + t / 100;
        var n = noise(noiseValue) / 200;
        n += noise(noiseValue) * 2 * y;
        y += n;
        y *= 300;
        var n2 = noise(t / 50);
        var n3 = noise(100 + t / 50);
        var lineWidth = graphiteWeight;
        x *= lineWidth;
        if (x <= 0) {
            x *= n2;
        } else {
            x *= n3;
        }
        var mapCrayon = map(y, -200, 0, 80, 255);
        mapCrayon = constrain(mapCrayon, 0, 255);
        fill(round(mapCrayon));
        push();
        var nGrain = noise(t) * lineWidth * 1;
        translate(random(nGrain), random(nGrain));
        ellipse(x, 0, 2);
        pop();
    }
}

function keyPressed() {
    if (keyCode === 32) {
        if (looping) {
            noLoop();
            looping = false;
        } else {
            loop();
            looping = true;
        }
    }
}

function frameExport() {
    var formattedFrameCount = "" + frameCount;
    while (formattedFrameCount.length < 5) {
        formattedFrameCount = "0" + formattedFrameCount;
    }
    save("grooves" + formattedFrameCount + ".png");
}
Scribbled notes
What I may require is a Line class. Any process could create a new instance of Line and send line segments to it as pairs of vectors. The Line class would automatically deal with the Perlin noise: it would make sure that each new line segment is added in a coherent way to the rest of the line (continuing its shape and varying width). The class would also deal with the beginnings and endings of lines. Its Line.drawSegment() method could receive an ending boolean to know that it needs to finish the stroke. When receiving a “terminating” segment, the class could put itself in a terminated mode. Any new line segment received after that would reactivate it and make it draw a line beginning. Or should a line that receives a terminating segment just destroy itself? Remove itself from an array of available lines, for example?
It could also be interesting to separate the moment when a line segment is sent to an instance of Line from the moment when this segment is drawn. An instance of Line could have an array of line segments to draw. When it would receive new ones, it would simply add them to this array. This would be done with the Line.addSegment() method. The Line.drawSegment() method would draw the next line segment from the array, and then remove it from there (or change its state to drawn). This way, thousands of line segments could be added to a Line in the same frame of animation but then, instead of all drawing them immediately (which would slow the program down considerably), these line segments could be drawn over the course of any number of consecutive animation frames. There would also be a way to control the speed at which a Line is drawn.
I could use the randomGaussian() function included in p5.js instead of using my own equation for the normal distribution.
Last year’s code uses one-dimensional Perlin noise to “fragment” the normal distribution, but clearly it should use two-dimensional noise.
The visual unpleasantness with the narrowest and widest lines is probably all about dot density. All the circular lines on the top of this page have the same amount of dots per line segment—so the narrowest lines have too much dots and look too crowded, too blockish, while the widest lines look too airy or bushy. Changing the width of the lines should obviously change their dot density.
Less probable ideas: while still only using two-dimensional mathematics, we could imagine modeling the whole circonference of the pencil lead. It would be a curve broken apart by noise but curve that folds on itself—or repeat itself on the x axis. We could even rotate the direction of the lead to accompany the movements of the pencil. We could also model the progressive degradation of the lead.
Sources
My thinking for this project started with a reading of Automatically Mimicking Unique Hand-Drawn Pencil Lines, an article signed by Zainab AlMeraj, Brian Wyvill, Tobias Isenberg, Amy A. Gooch, and Richard Guy. In the end, I did not use the methods detailed in this article but it was an inspiring read nonetheless.